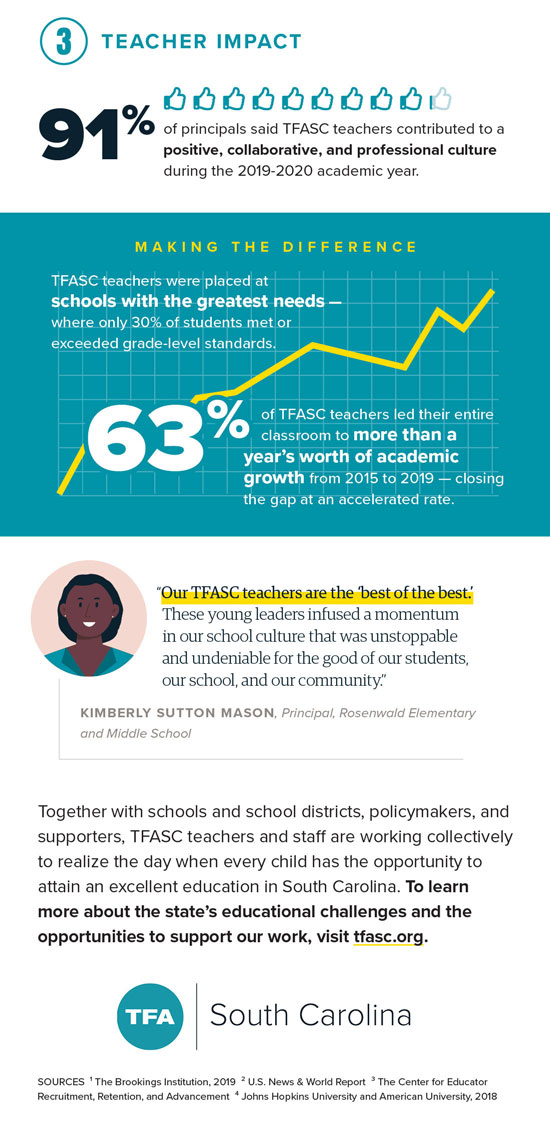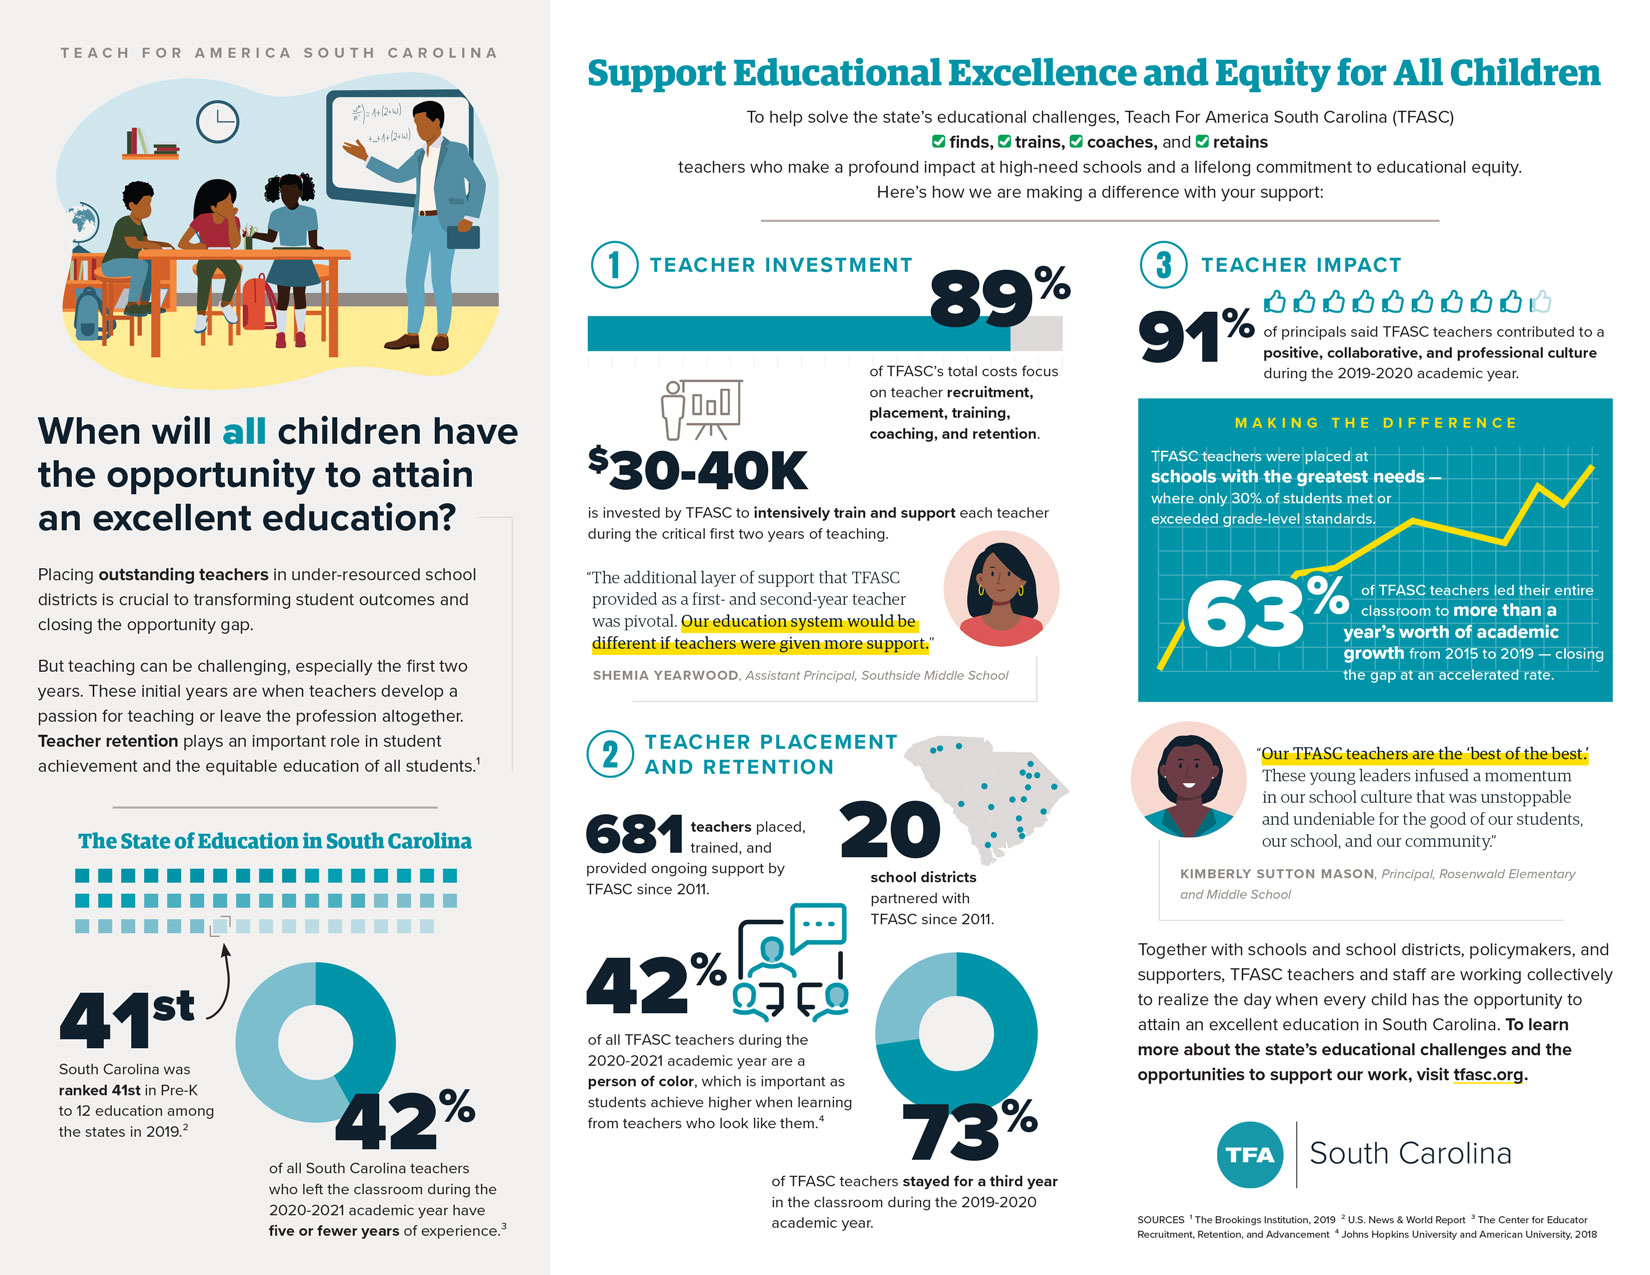
Teach for America South Carolina had an interesting challenge: an infographic that could be used either as a letter-size leave behind, or a long-scrolling web or phone page. I solved this problem by dividing the letter page into three columns and then organizing the information in a way that would make sense with the columns stacked. I also found art that we could use to create “headshots” of the quoted speakers, and designed all the charts and graphs.